Fitting a subset of the Data
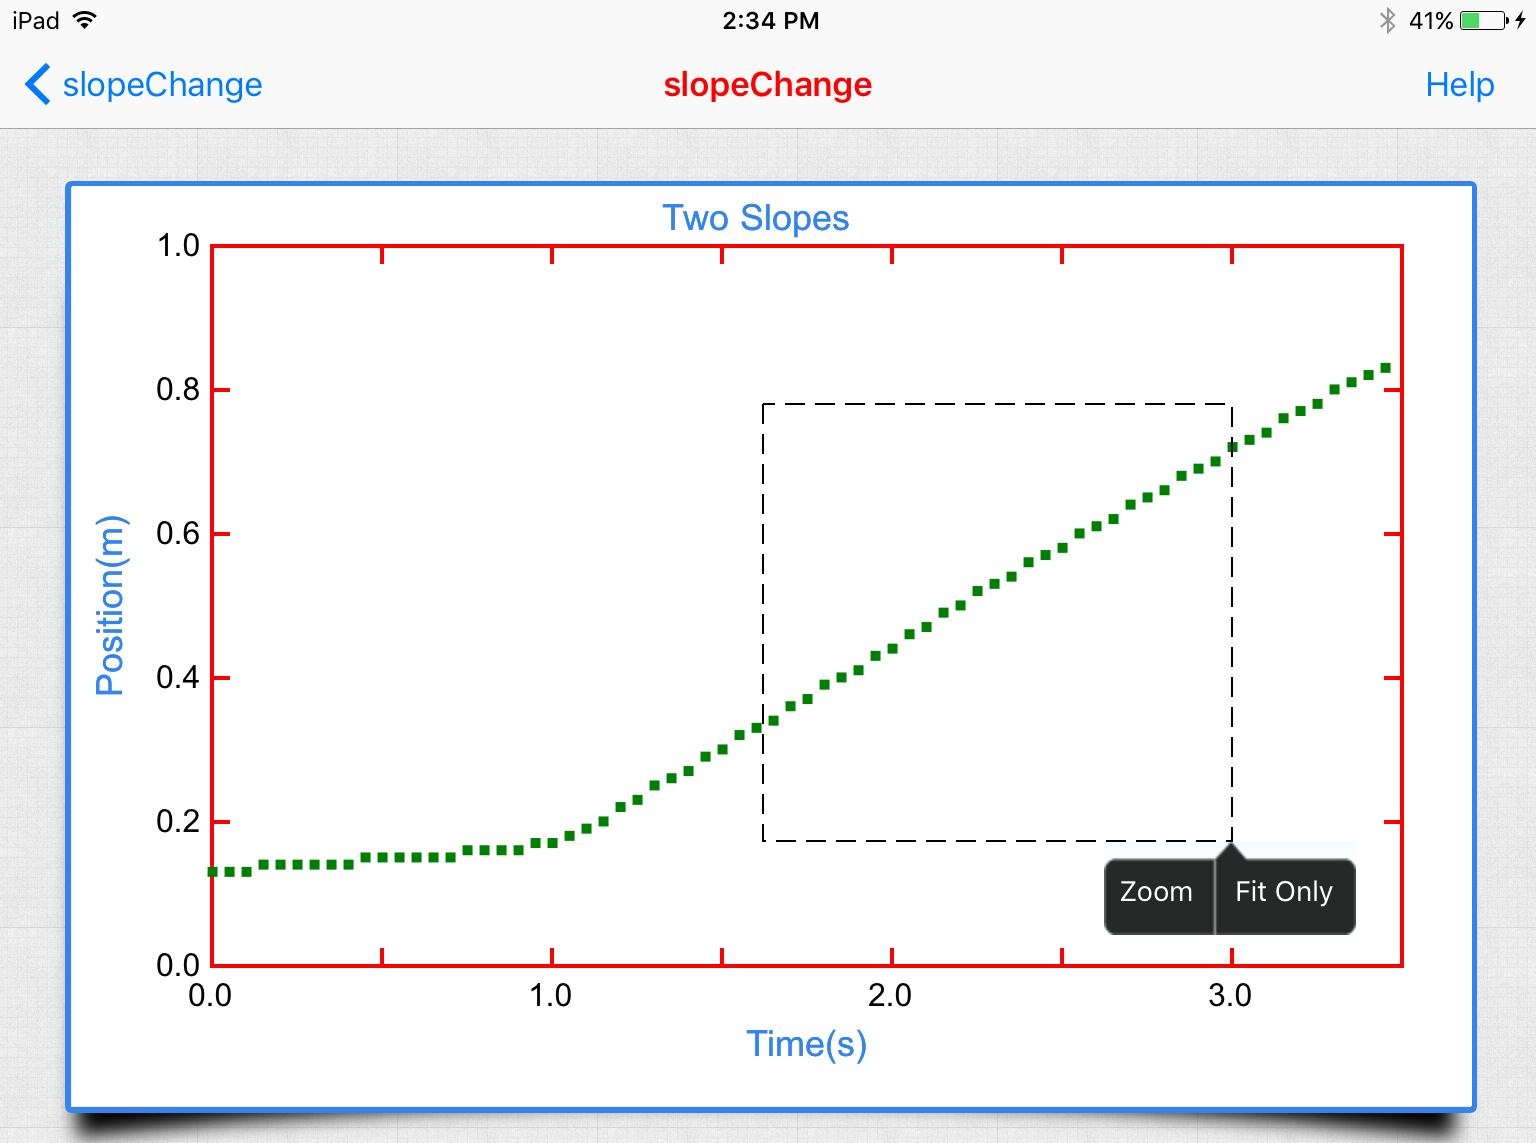
The user can zoom into a particular area of the data by drawing a rectangle about the area of interest.
Draw the rectangle by pressing your finger at the upper left end of the desired rangle (see below, A) then dragging your finger to the lower right end of the range (see below, B) and releasing.
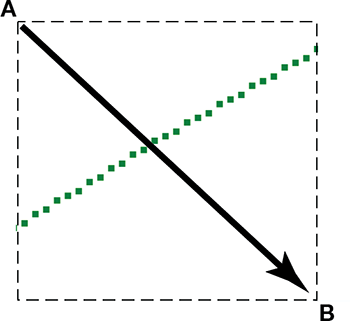
If the range is not correct, simply start again and the old zoom rectangle will be removed.
Upon release two options are available:
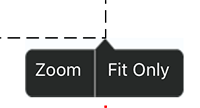
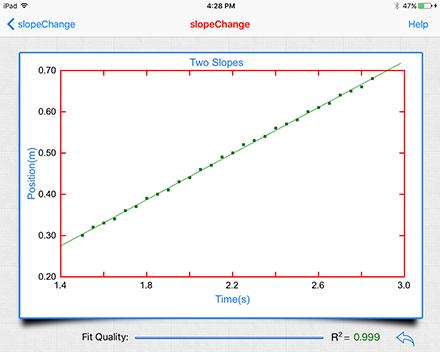
Zoom: By pressing the Zoom button, the graph enlarges to the desired size. Fitting the data now will result in all the data being fit, but only the portion that was zoomed being displayed.
Fit Only: By pressing the Fit Only button, the data within the zoom rectangle is fit to the selected function. Data outside the zoom rectangle is disregarded in the fitting process.
![]() Use the back button to return to the original view of the full data set.
Use the back button to return to the original view of the full data set.