What is a standard curve?
A standard curve or sometimes called a calibration curve is a data set the represents the response to known amount of a material in a particular test.
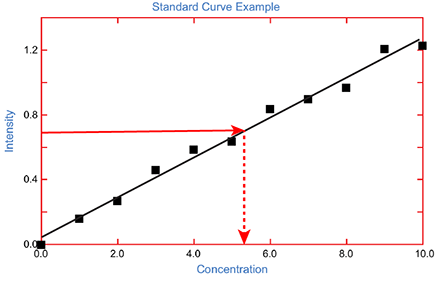
Since many chemical compounds exhibit a color in solution, one often uses a calibraton curve, which is a plot the intensity of the color versus the concentration of the compound. These curves are typical linear but other shapes of standard curves are also possible.
Once a standard curve plot is available, it can be used to determine the concentration of the compound in samples of unknown concentrations.
As seen in the standard curve example on the right (top), if an intensity value of 0.68 was measured, one could use the standard curve to determine that the concentration of the material was 5.2 units.
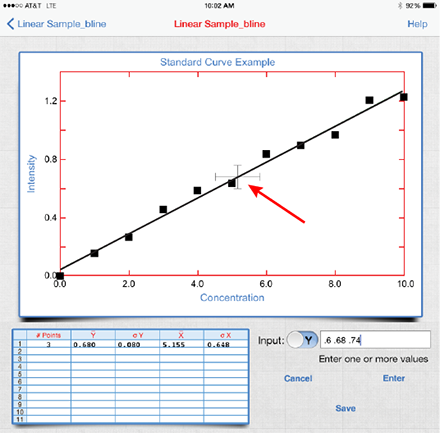
Data analysis often involves measurement of more than one sample and then determining the confidence of the result. In the example shown (right bottom), a sample was measured three times. The intensities measured were 0.6, 0.68 and 0.74. These can be directly input in the standard curve analysis. Once enter is pressed the program will calulate the average and the corresponding deviations. The error is shown graphically as indicated (right bottom) by the red arrow.