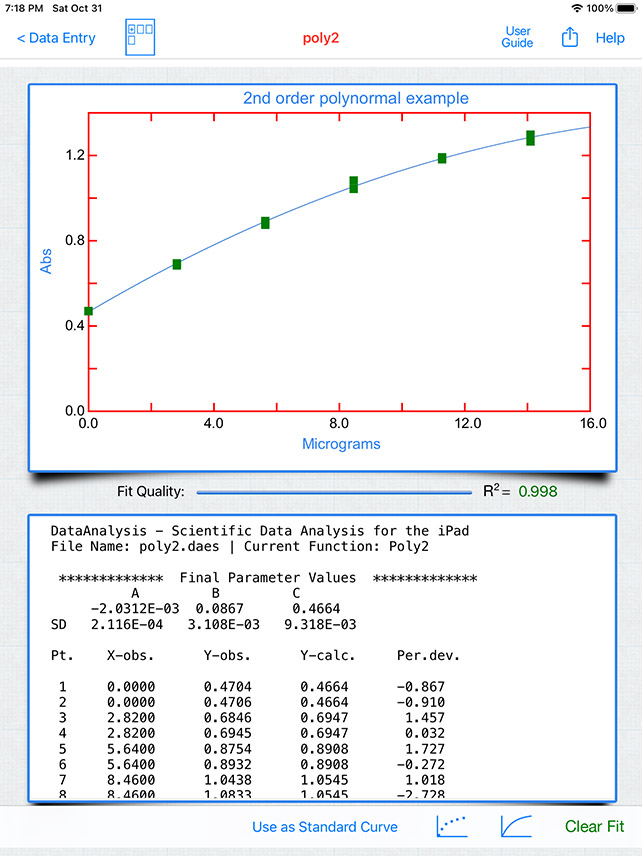
Using the fit as a standard curve
After fitting the data to some of the functions it is possible to use the fit as a standard curve option. This option allows the user to enters y value(s) and x value(s) are calculated.
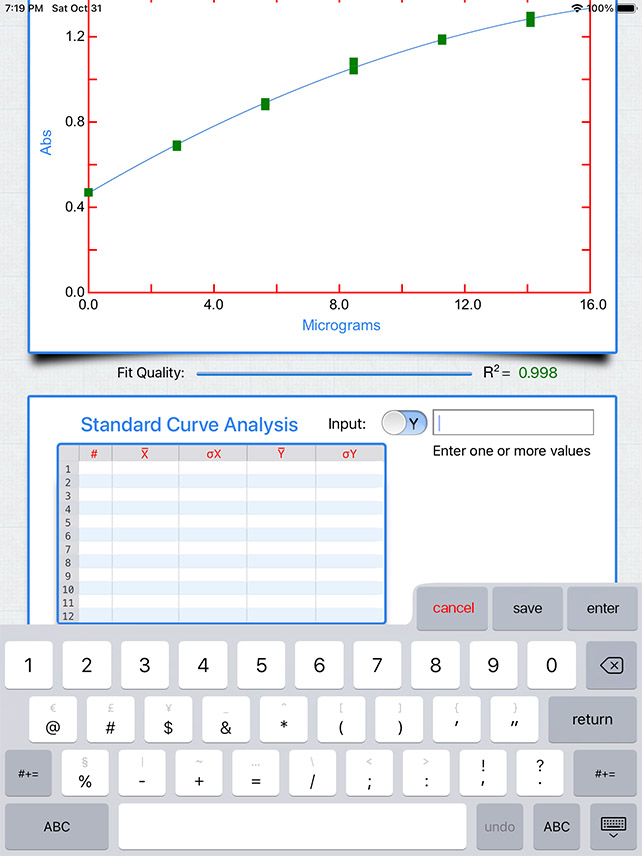
![]() This button brings up the keyboard along with a new view area. The user can enter a single Y value from which the X value is calculated.
This button brings up the keyboard along with a new view area. The user can enter a single Y value from which the X value is calculated.
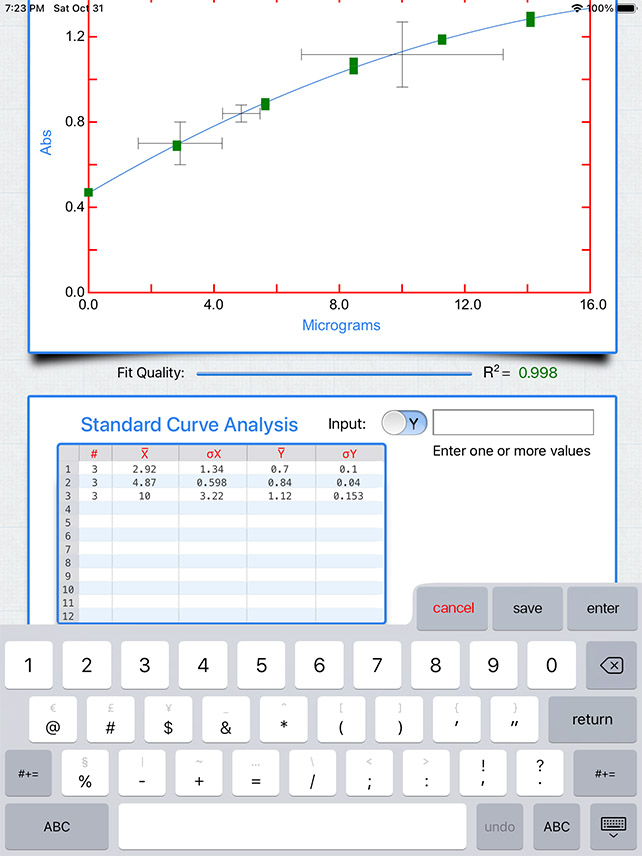
Alternatively, the user can enter a number of Y values (separated by one or more spaces) that will be averaged and then used to obtain a single X value.
By using the X/Y slider the user can either X values to calculate the corresponding Y values or Y values to calculate the corresonding X values.
Cancel: Cancels this mode and no data is saved.
Save: Saves the results of the analysis onto the end of the output and returns to the regular program mode.
Enter: Calculates the X or average X value and plots either an arrow (1 value) or error bars (more than 1 value), respectively.