Plot and graph options
After pressing the Plot button on the Data Entry page, the data are plotted and the graph is shown at the top of the page. The bottom select of the page is devoted to the non-linear regression analysis.
![]() The action button allows the graph to be saved in a variety of formats and printed. See Working with Files.
The action button allows the graph to be saved in a variety of formats and printed. See Working with Files.
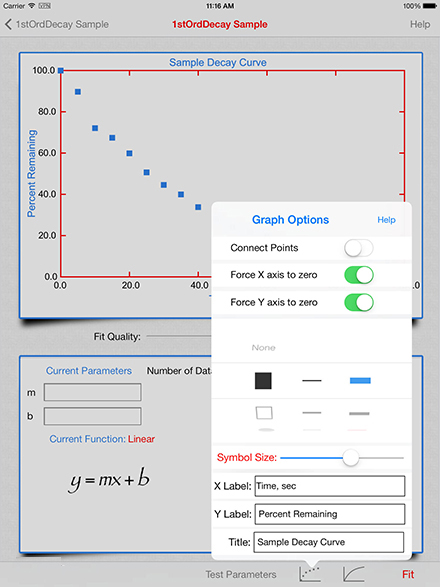
![]() The Graph Options button activates the Graph Options Popover, which provides number ways to customize the appearance of the graph.
The Graph Options button activates the Graph Options Popover, which provides number ways to customize the appearance of the graph.
Connect Points: ON, will connect the points, drawing a straight line segment between each point.
Force X and Force Y axis to zero: ON, will start the X and Y axis respectively at zero, independent of what the xmin and ymin values are.
Symbol, Line and Color Picker can be used to change the symbol, the line thickness, dashed lines and color.
Symbol Size Slider can be used to change the symbol size.
X and Y Labels and a Title for the graph can be entered.