Manual scaling of the graph axes
There are circumstances in which the auto scaling of the x- and y-axis may not be appropriate or what is desired.
There are two different ways to override the default auto scaling.
By accessing the Graphics Options via the Graph Options bar button, ![]() the user can select to force the x and/or y-axis to zero. These means that no matter what the lowest X and Y values are, the problem with set the Xmin and/or Ymin to zero.
the user can select to force the x and/or y-axis to zero. These means that no matter what the lowest X and Y values are, the problem with set the Xmin and/or Ymin to zero.
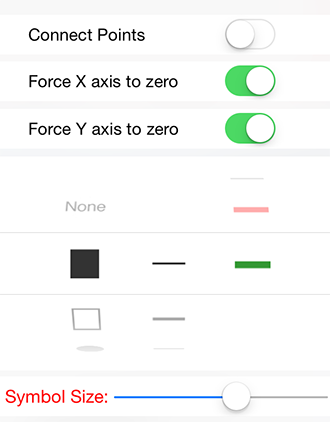
The default values for the force X and Y-axis can be set from the DataAnalysis Settings Menu from iOS setting.
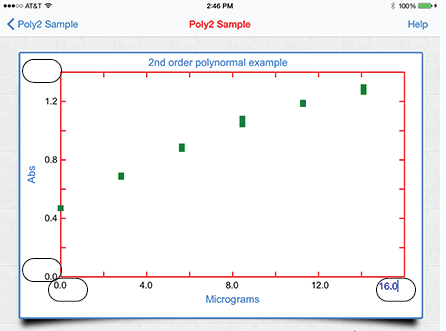
A more direct method to accomplish manual scaling is to modify the x-minimum, y-minimum, x-maximum, and/or y-maximum directly on the Graphics Screen. By double tapping in one of the four regions shown in the figure on the right (tiop) one can directly iinput the x-minimum, y-minimum, x-maximum, and/or y-maximum values directly. After each value is entered a return saves the modification.
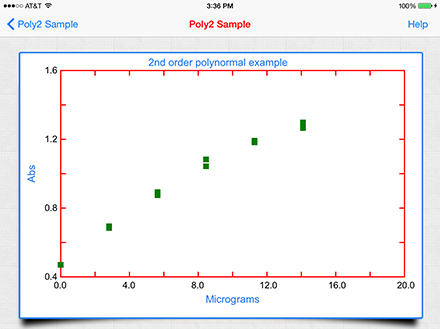
In the example shown on the right (bottom), the x-maximum was reset to 2.0, and the Y-minimum was reset at 0.4.