Lowess Nonparamatic Regression
After pressing the Plot button on the Data Entry page, the graph is plotted and is shown at the top of the Graphics page. The bottom selection of the page is devoted to the regression analysis.
Lowess Regression (LOcal Weighted regrESSion) does not require a mathematical function and does not require parameters (non-parametric). This fitting method is especially useful for data that does not conform to a specific mathematical model or the mathematical model is unknown.
To use the Lowess Regression select it from the Least-Squares Algorithm segmented control (see below).
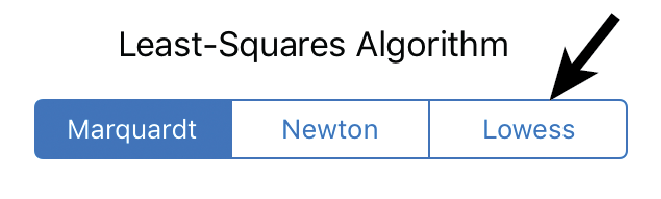
After selecting the Lowess method simply press the fit button.
![]() to perform the Lowess regression.
to perform the Lowess regression.
The Lowess regression has two user adjustable controls.
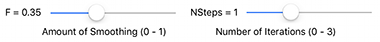
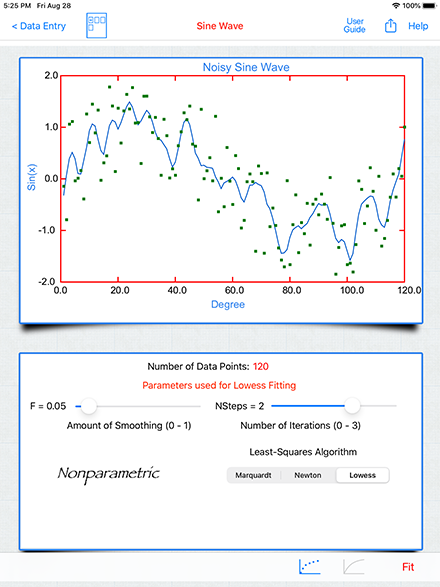
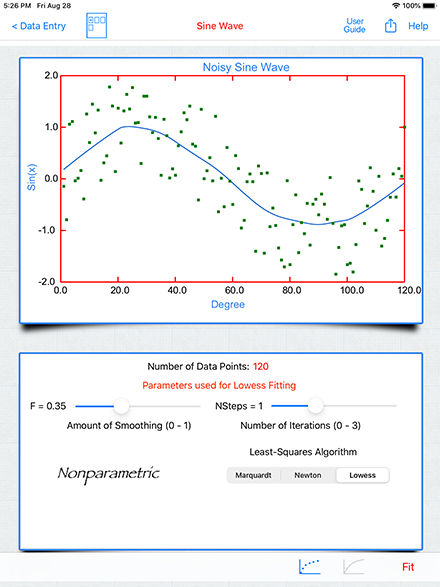
F: Specifies the amount of smoothing, as F increases the curve becomes smoother. F values between 0.2 to 0.8 usually result in a good fit.
NSteps: The number of iteration steps in the robust fit. Zero for no robust fit. Typical values are 1 or 2.
After the initial Lowess fit, the F and NStep parameters can be adjusted simply by moving the appropriate slider control.
For more information on Lowess Regression see Cleveland, W. S. (1979), “Robust locally-weighted regression and smoothing scatterplots,” Journal of the American Statistical Association, 74, 829-836
The Loess regression is a extension of the Lowess method. One main difference is that Lowess uses a linear polynomial, while loess uses a quadratic polynomial to fit local subsets of the data.