Simple Linear Fit
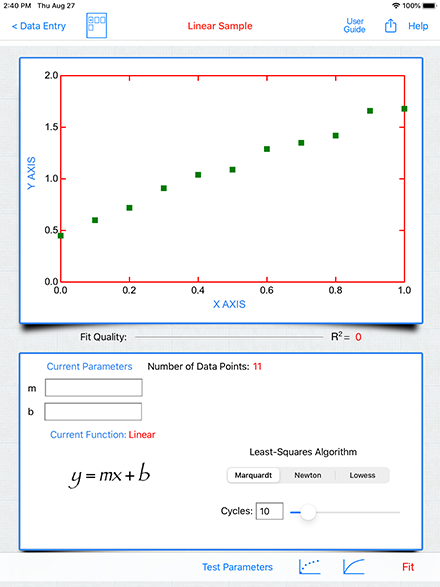
After pressing the Plot button on the Data Entry page, the graph is plotted and is shown at the top of the Graphics page. The bottom selection of the page is devoted to the non-linear regression analysis.
The default function for the program is a linear fit (y = mx + b). The user can enter initial parameters but in this case they are not necessary.
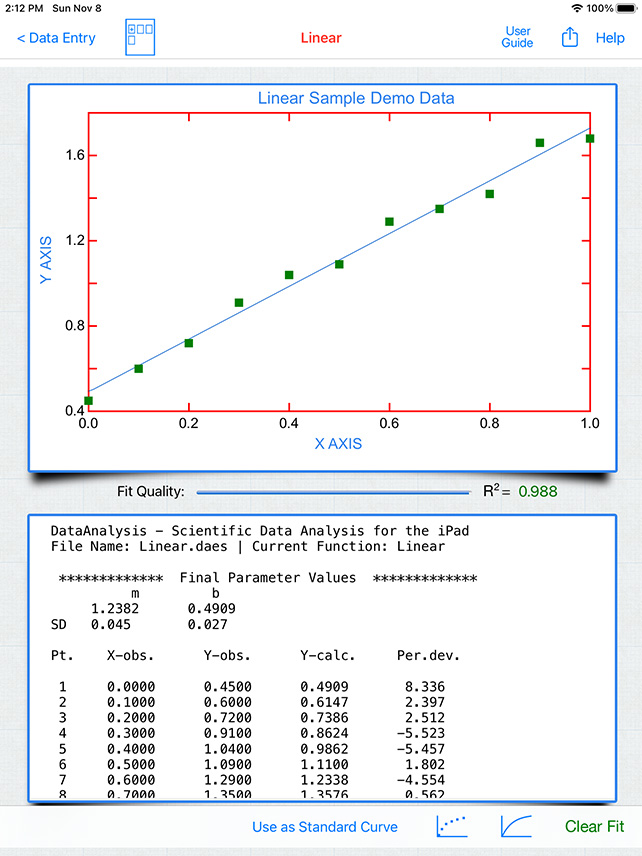
![]() The fit button begins the least-squares procedure. When the final parameters have been calculated the theoretical curve is drawn on the graph and the final parameters are shown.
The fit button begins the least-squares procedure. When the final parameters have been calculated the theoretical curve is drawn on the graph and the final parameters are shown.
Least Square Method: The user has the option to use the Marquardt or Newton Methods for the non-linear regression. The Marquardt works better when the initial parameters are far from the final ones. The Newton method is faster when the initial parameters are close to their final values.
Cycles Slider: The number of cycles for the non-linear regression can be set.
 This button reveals the functions popover from which other functions can be selected for the non-linear regression.