Non-Linear regression
After pressing the Plot button on the Data Entry page, the graph is plotted and is shown at the top of the Graphics page. The bottom selection of the page is devoted to the non-linear regression analysis.
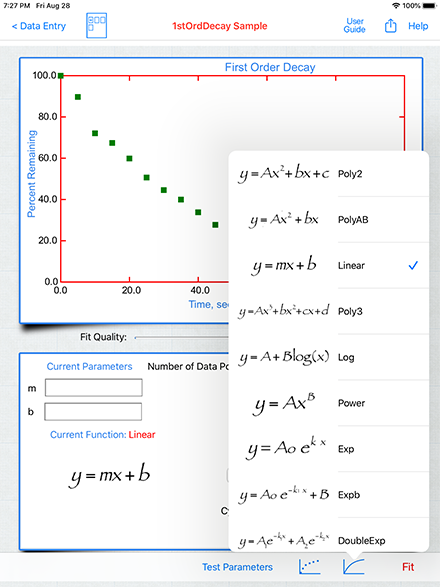
The default function for the program is a linear fit (y = mx + b). The user can enter initial parameters but in this case they are not necessary.
 This button reveals the functions popover from which the various mathematical functions can be selected for non-linear regression. See the Regression Functions section for a full description.
Simply press on the function to be used in the non-linear regression. If you leave the current parameters blank and the function selected requires initial parameters you will be requested to enter them before the fitting will continue.
![]() For some functions reasonable guesses of initial parameters is required. One way to check if parameters are reasonable is to use the Test Parameters mode. After the parameters are entered the user has the option to draw the selected function with the current parameters. The parameters can thus be varied until suitable ones are obtained, which then can be used as the initial guesses for the non-linear regression analysis.
For some functions reasonable guesses of initial parameters is required. One way to check if parameters are reasonable is to use the Test Parameters mode. After the parameters are entered the user has the option to draw the selected function with the current parameters. The parameters can thus be varied until suitable ones are obtained, which then can be used as the initial guesses for the non-linear regression analysis.