Error Analysis
Standard Error of the Mean
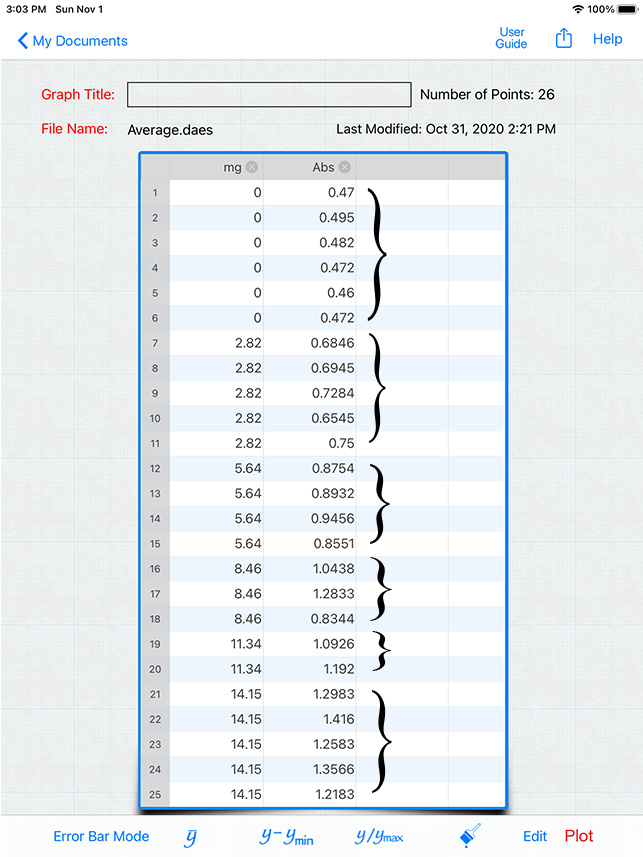
Standard error of the mean can be calculated from data in which a number of data points are entered with the identical x value. For example, the dataset on the right has 6 values all with x = 0, 5 values with x = 2.82, 4 values with x = 5.64, 3 values with x = 8.46, 2 values with x = 11.35 and 5 values with x = 14.15.
When data has a series of values with the same x value, the average button![]() will calculate the standard error for a minumium of 3 of the same x values, the average for 2 of the same x values and not error if only one value.
will calculate the standard error for a minumium of 3 of the same x values, the average for 2 of the same x values and not error if only one value.
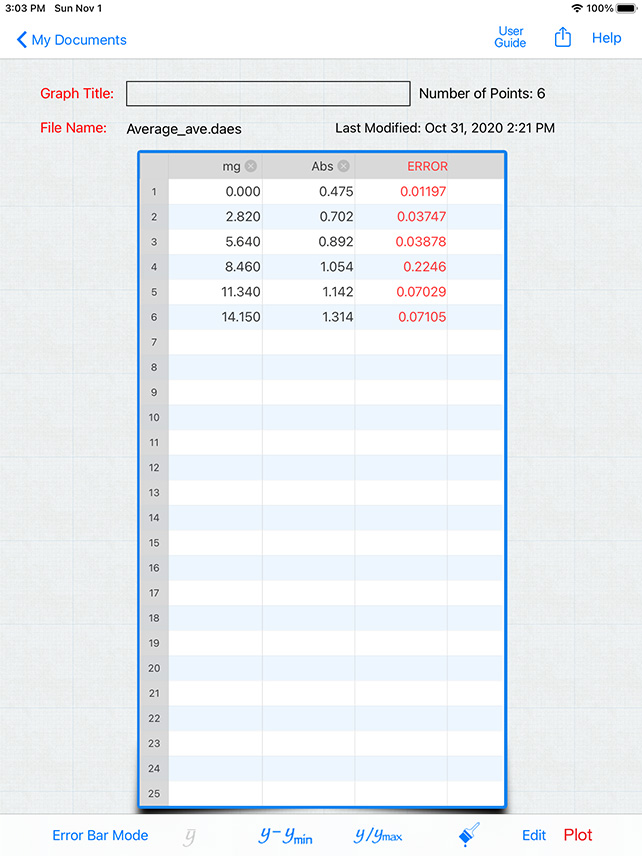
Shown on the right (After Data Processing) is the Data Entry view after the average has been performed and the standard errors have been calculated.
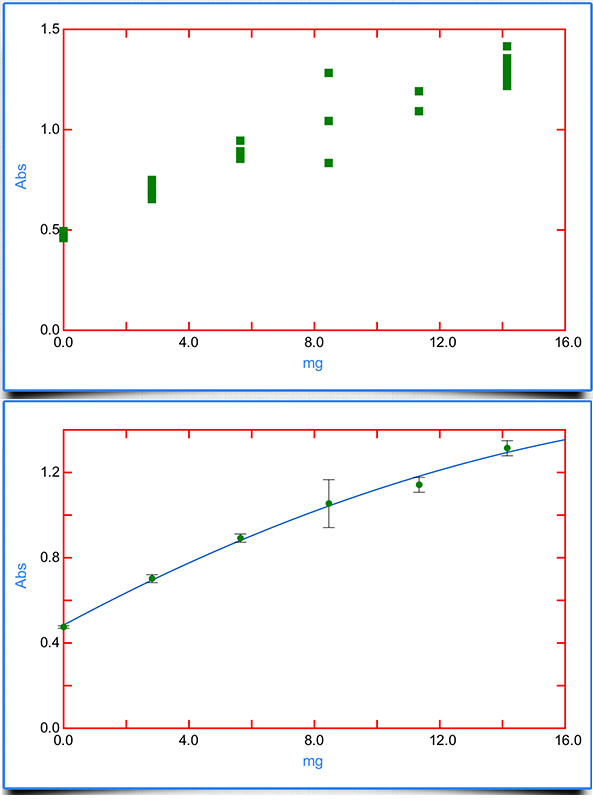
The graph below (TOP), are the data after entry, corresponding to the spreadsheet shown on the right top. The graph below (BOttoM) shows the same data after standard error processing.